

Axial transport in dry ball mills
Ball mills are used for grinding of rocks, cement clinker and limestone from 10-100 mm feed sizes down to sub-millimeter product. They are typically rotating cylinders with diameters from 3-6 m and lengths from 6-12 m. The flow of particulate solids within these mills can be modeled using the discrete element method (DEM). Typically, such modeling is done for short durations of a few mill revolutions and either in two dimensions or using thin three dimensional slices through the center of the mill with periodic boundary conditions in the axial direction. This facilitates an understanding of the radial motion of the charge, estimation of power draw and of liner wear, but it cannot provide information about axial transport within the mill. In this paper, we examine the axial transport in dry ball mills. This requires simulation of the entire mill and the full volume of the charge for significant periods of time (thousands of revolutions). We use a simple model for grate discharge that allows prediction of the time varying axial distribution of different particle sizes within a discharging ball mill. The distributions of sub-grate size ‘fines’ is shown to satisfy a one dimensional diffusion equation with the diffusion coefficient decreasing with grate size. A pulse test, where a single mass of fines in injected at the feed end, is able to quantify the residence time distribution of the fines.
Introduction
Simulation of tumbling and other types of mills by DEM offers the opportunity of better understanding the internal mill dynamics and of developing improvements to mill design and operation that can lead to large increases in mill efficiency and throughput. DEM has been used for modeling a wide range of industrial applications, particularly in milling. Early work on ball mills by mishap and raja mani (1992, 1994) has been followed by Cleary (1998b, 2001b). Similarly sag mills were modeled by raja mani and mishap (1996) and subsequently by Cleary (2001a). Until fairly recently mill modeling was performed in two dimensions. Over the past five years this has been replaced by the simulation of thin axial slices with periodic boundary conditions (Cleary and swale, 2002 and Cleary, 2001c).
Detailed experimental validation has been performed for a centrifugal mill by Cleary and Hoyer (2000) and for a 600 mm diameter laboratory sag mill by Cleary et al. (2003). These studies give reasonable confidence that the flow behavior predicted accurately represent real particulate motions in dry mills.
In this paper we turn attention to the axial transportation of fine material in a ball mill that is able to discharge from one end. This requires simulation of the entire mill length.
Ball mill configuration
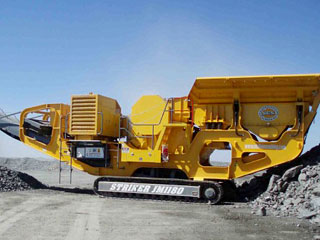
The ball mill used in this study was 5 m in diameter and 7 m long. Figure 1 shows this ball mill with an opening cut in the front to allow the mill internals to be seen. The fill level was 30%by volume and the mill speed was 75% of the critical speed required to centrifuge particles. The charge consisted of rocks and balls, with balls making up 48.6% by volume of the charge. The ball size distribution used was 75 to 200 mm and the rock size distribution was 25 to 100 mm. The specific gravity of the rock was 4. the
Total number of particles in this mill was 122, 000 weighing 114 tones. The DEM simulations were performed in 3d. The simulations were of a dry mill, so there is no slurry motion to assist in the transport of the particulates, they move solely as a result of the particle dynamics. In these simulations we use a standard coefficient of restitution of 0. 3 and a coefficient of friction of 0.75 (Cleary, 2001b).
It is important to note that 3d simulations, with these numbers of particles, over the timescales needed for significant axial transport to occur, take enormous amounts of computer time(of the order of many months).
The simplest way to simulate a discharge grate in a flat ended mill is to make this permeable to particles below a certain grate opening size g. Such a grate is 100% efficient in that all fines that reach the grate immediately exit the mill. This is, of course, not the case for real mills, but it is a reasonable starting point for studying axial transport. This approach allows us to plausibly model the system and to study the critical physical processes in the axial direction.
End wall effects
Most DEM models of mills involve taking a thin periodic slice from the middle of the mill. In this case we have included flat end walls, so it is useful to understand the effect of these walls on the flow of the particles. To begin, we simulate the flow in the mill with solid end walls. After a short time fairly strong axial segregation is observed near the end walls due to the high shear they induce. This concentrates finer material directly adjacent to the walls. Figure 2 shows the distribution of mass (dark grey curve in upper plot), particle number (light grey in the upper plot) and the average particle size (lower plot) in thin slices along the length of the mill (parallel to the end walls). We find that even when there is no inflow or outflow from the mill then composition gradients in the axial direction are still observed. The lower mass in the end regions means that the bulk density of the charge is much lower indicating that the end wall shear is inducing significant dilation to the charge. This enhances particle mobility and facilitates size segregation. This leads to the average size of particles near the end walls being around 15%smaller than in the bulk of the charge.
The ball mill is initially uniformly filled with rocks and balls which are perfectly mixed. Figure 3 shows the charge in the mill after 4 minutes of rotation (at 75% critical). The charge has been clipped by a vertical plane passing down through the center of the mill so that the internal distribution of particles can be seen. In the upper frame we see that there is very strong radial segregation leading to fines being concentrated near the liner at the top and bottom of the mill and a clear reduction in fines towards the discharge end of the mill. The lower frame shows that the majority of material near the discharge end is larger than the grate size (orange) indicating that significant discharge of fines (blue) has already occurred. The change in the composition of the mill along its length can be evaluated by calculating the mass of coarse and fine fractions in vertical slices along the mill axis. The change in the distribution of these fractions allows us to follow the axial flow of fine material.
Figure 4 shows the time variation of this distribution of fines along the mill for g=60 mm, a fill level of 30%and a mill speed of 75%critical. The black curve is the measured distribution from the DEM solution. The dashed line shows the initial distribution. At 10 s, around half the fine material in the end slice closest to the discharge end has flowed from the mill. The fines distribution is essentially constant along the rest of the mill.
After 1 minute of mill rotation, the fines level in the discharge end of the mill has dropped to about 1/3 of its original value. Fine material in the adjacent slices (up to 3 m from the discharge end) has now started flowing axially along the mill and is also discharging. There is an increase in the mass of fines in the first slice adjacent to the non- discharging end. This is caused by the segregation induced by the solid end wall shear (as reported in the previous section). This produces a slight reduction in fines around 1 m from the wall, which is the source of the additional fines segregating towards the solid end.
By 3 minutes, the amount of segregated fines near the solid end has reached it peak and the dip in the fines at around 1-2 m from the start of the mill is also reached its maximum. The fines fraction at the discharge end is now just 10%of its original level and the flow of fines from the middle of the mill towards the discharge end is observable back to the 2-3 m region.
At 10 minutes, a significant reduction in the amount of fines has occurred along the full length of the mill and even the fines enhanced region at the start of the mill is now loosing fines.
By 30 minutes of operation, the fraction of fines at the start of the mill has been reduced by a 1/3 and there is very little fine material in the right half of the mill. This process continues until the fines are completely removed. In the absence of slurry or fluids, a reasonable conjecture would be that this axial transport process for fines is a diffusive one. To test this a time varying error function is fitted to the DEM predictions of the axial distribution of the fines. The scaling coefficient in this solution is chosen by a least squares method to minimize the difference over both space and time of this solution from the DEM prediction. This solution is shown as the smooth grey curves in figure 4. it is clear that this analytic solution fits the DEM predictions very closely. The only divergence is the segregation enhanced fines region and adjacent fines reduced region induced by the end wall shear at the start of the mill. An error function solution of this form is precisely the solution of a 1-d diffusion equation. This means that axial transport along a dry mill is purely diffusive and is not affected by the three dimensional details of the actual particle flows. The constant in the error function solution determined by the least squares process is then just a diffusion coefficient d. For this particular case d=0. 0133.
The diffusive nature of the dry axial transport can be understood when considering the nature of the particulate flow. Charge material is dragged upwards by the motion of the liner and then avalanches down the free surface or thrown through the air as an attracting stream. The material in the attracting stream is ballistic and its motion will be predominantly in the radial-circumferential plane of the mill (orthogonal to the mill axis). The attracting material will therefore not generate any net axial transport of any of the components. In the avalanching stream, the material flow cascades from shoulder region. Consider the particulate flow from one particular axial location on that shoulder. As the material in that region avalanches down the surface, collisions with other particles cause the material undergo a random walk type of perturbation. Some particles are knocked in each axial direction with equal probability. This causes the material to spread out axially creating a widening fan shape as material moves down the free surface, with a particle having a normally distributed probability of being located at any specific axial location.
If this was a discrete avalanche this would lead to the fan shape of flow that is observed on point initiated avalanches on piles everywhere. If there is a composition variation along the mill, the half of the fan of spreading material that is on the discharge side is moving from a region of higher fines to one with lower fines. Material moving away from the discharge end is moving into a region of higher fines. If one considers the nature of the mass flow into and out of a slice of the mill’s axial length, then some of the material is entering the slice from the discharge end and has lower fines content, whilst material moving into the slice from the other end has higher fines content. The distance from which the material has travelled (and therefore the magnitude of the enhanced or reduced fines level compared to that of the slice) is determined by the width of the diverging avalanche which is in turn is governed by the random walk nature of the specific particle trajectories and the normal probability distribution in the axial direction for the spread of this material as it travels down the slope. This is a fundamental description of an inherently diffusive process. So in the slice considered there is a net transfer of finer material from upstream to downstream and the rate at which it is transported in controlled by the diffusive nature of the particles spreading out as they avalanche down the free surface of the charge? If one considers the overall material balance, there are equal amounts of material migrating into any specific slice, but the composition differences lead to a net migration of one of the components.
Size dependence of the diffusivity D
DEM simulations were performed with different discharge grate sizes in order to determine the sensitivity of the axial flow of fines to the size of the fine material. Table 1 shows the variation of the axial diffusion coefficient as a function of the fines particle size. This shows a weak but definite pattern of decreasing axial diffusivity with decreasing particle size. This can be understood by again considering the nature of the diverging fan of material flowing down the free surface from a single initiation point. The distance that a specific avalanching particle is able to travel axially depends on how much momentum it has and its chances of being trapped in the surrounding particle microstructure. As a particle gets smaller it is more able to fall into and become trapped in voids between larger particles and its decreasing momentum means it needs to collide less times before it ceases motion. These fundamental trends lead one to expect that material should become progressively more difficult to transport by pure diffusive processes as they become smaller. This is confirmed by the DEM simulation predictions. This behavior is of course why dry mills are air swept to remove fines and why most mills are operated wet so as to wash the fines out of the mill significantly faster.